Small-multiple ranges with a highlighted mean dot
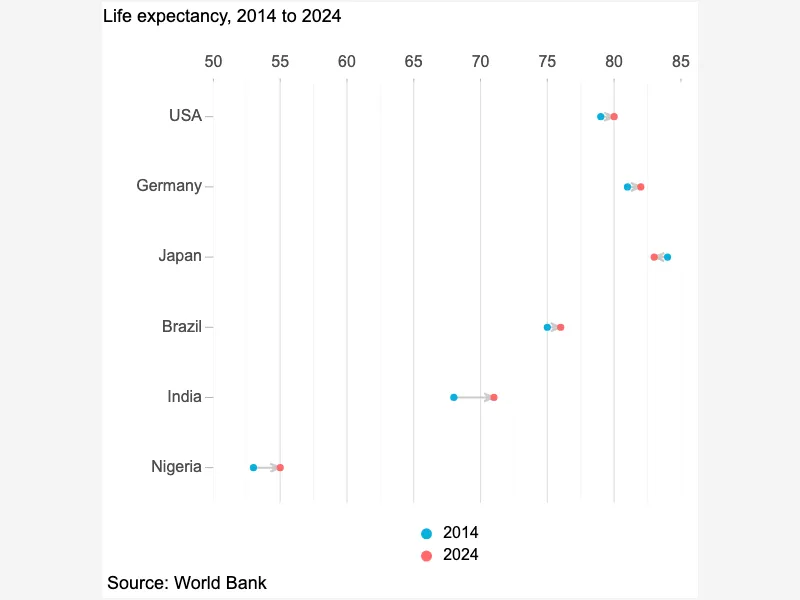
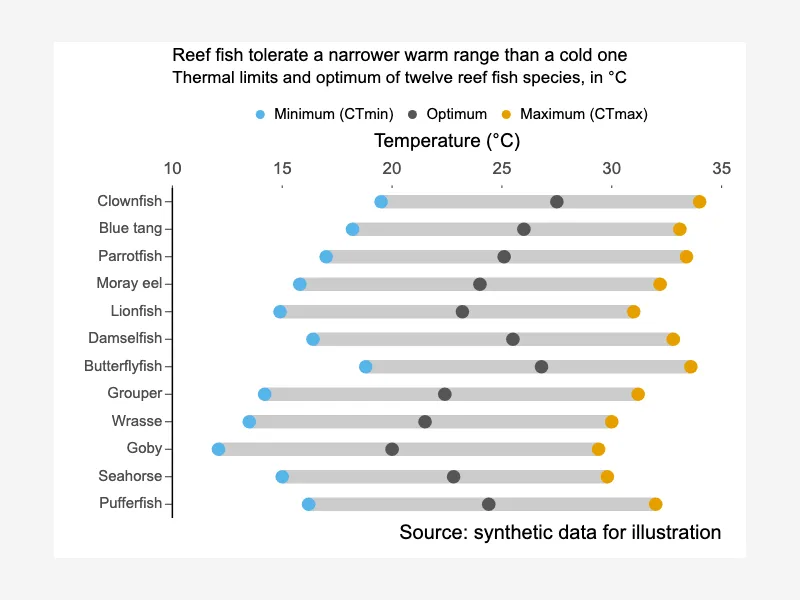
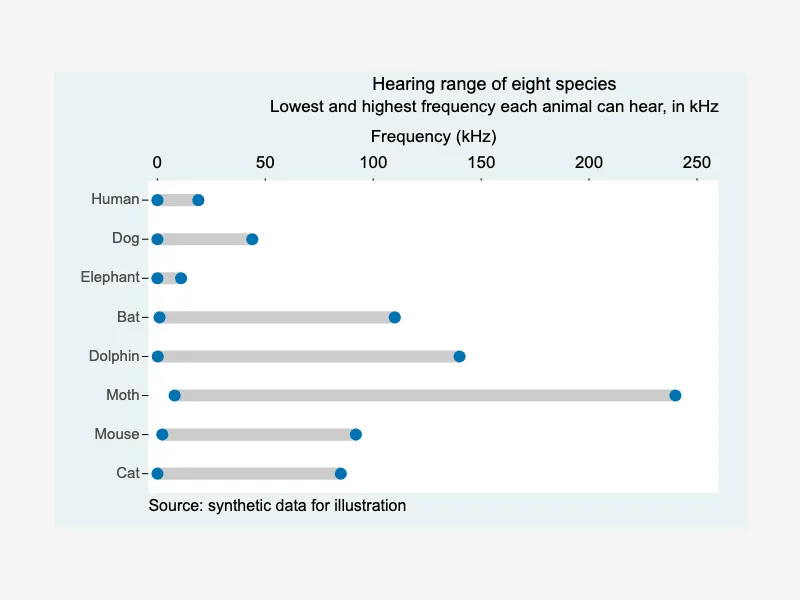
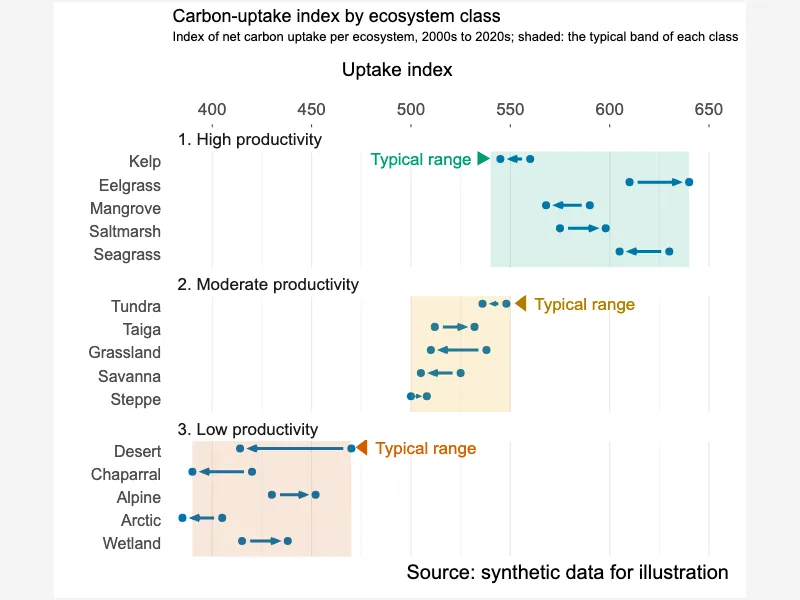
Dumbbell graphs display the relationship between two data points for multiple categories by connecting them with a line. It effectively shows the difference or change between these two values for each item, allowing for easy comparison of magnitudes and variations across the dataset. This visualization is useful for highlighting shifts or disparities.


<html>

  <head>
    <!-- Include the CanvasXpress library in your HTML file -->
    <link rel="stylesheet" href="https://www.canvasxpress.org/dist/canvasXpress.css" type="text/css"/>
    <script src="https://www.canvasxpress.org/dist/canvasXpress.min.js"></script>
  </head>

  <body>

    <!-- Create a canvas element for the chart with the desired dimensions -->
    <div>
      <canvas id="canvasId" width="600" height="600"></canvas>
    </div>


    <!-- Create a script to initialize the chart -->
    <script>

      // Use a data frame (2D-array) for the graph
      var data =

      // Create the configuration for the graph
      var config = {
         "graphType" : "Dumbbell",
         "graphOrientation" : "horizontal",
         "dumbbellType" : "connected",
         "theme" : "minimal",
         "colorScheme" : "User",
         "colors" : [
            "#bdbdbd",
            "#bdbdbd",
            "#009E73"
         ],
         "title" : "Fasting glucose by age group",
         "subtitle" : "Mean and 95% interval (mmol/L) before and after a 12-week high-fat diet",
         "xAxis" : [
            "Lower 95%",
            "Upper 95%",
            "Mean"
         ],
         "xAxisTitle" : "Fasting glucose (mmol/L)",
         "showLegend" : false,
         "smpLabelInterval" : 1,
         "dataPointSizeScaleFactor" : 2,
         "segregateSamplesBy" : [
            "Wave"
         ],
         "stripBackgroundBorderColor" : "rgba(255,255,255,0)",
         "layoutTopology" : "2X1",
         "decorations" : {
            "range" : [
               {
                  "value" : 3.9,
                  "value2" : 5.6,
                  "color" : "rgba(0,158,115,0.12)",
                  "tooltip" : "Normal fasting range"
               }
            ],
            "text" : [
               {
                  "value" : 6.1,
                  "smpId" : 0,
                  "panel" : 1,
                  "label" : "◀ Normal fasting range",
                  "color" : "#009E73",
                  "labelScaleFontFactor" : 0.9
               }
            ]
         },
         "citation" : "Source: synthetic data for illustration"
      }

      // Event used to create graph (optional)
      var events = false

      // Call the CanvasXpress function to create the graph
      var cX = new CanvasXpress("canvasId", data, config, events);

    </script>

  </body>

</html>
<html>

  <head>
    <!-- Include the CanvasXpress library in your HTML file -->
    <link rel="stylesheet" href="https://www.canvasxpress.org/dist/canvasXpress.css" type="text/css"/>
    <script src="https://www.canvasxpress.org/dist/canvasXpress.min.js"></script>
  </head>

  <body>

    <!-- Create a canvas element for the chart with the desired dimensions -->
    <div>
      <canvas id="canvasId" width="600" height="600"></canvas>
    </div>


    <!-- Create a script to initialize the chart -->
    <script>

      // Create the data for the graph
      var data = {
         "y" : {
            "vars" : [
               "Lower 95%",
               "Upper 95%",
               "Mean"
            ],
            "smps" : [
               "18-29",
               "30-39",
               "40-49",
               "50-59",
               "60-69",
               "70-79",
               "80+",
               "18-29 ",
               "30-39 ",
               "40-49 ",
               "50-59 ",
               "60-69 ",
               "70-79 ",
               "80+ "
            ],
            "data" : [
               [
                  4.6,
                  4.8,
                  4.9,
                  5,
                  5,
                  5.2,
                  5.3,
                  4.7,
                  5,
                  5.5,
                  5.9,
                  6.2,
                  5.8,
                  5.3
               ],
               [
                  5.3,
                  5.5,
                  5.5,
                  5.7,
                  5.7,
                  5.9,
                  5.9,
                  6,
                  6.5,
                  7.2,
                  7.9,
                  8.4,
                  8.2,
                  8
               ],
               [
                  5,
                  5.1,
                  5.2,
                  5.3,
                  5.4,
                  5.5,
                  5.6,
                  5.4,
                  5.8,
                  6.3,
                  6.9,
                  7.3,
                  7,
                  6.6
               ]
            ]
         },
         "x" : {
            "Wave" : [
               "1. Baseline",
               "1. Baseline",
               "1. Baseline",
               "1. Baseline",
               "1. Baseline",
               "1. Baseline",
               "1. Baseline",
               "2. After 12 weeks of high-fat diet",
               "2. After 12 weeks of high-fat diet",
               "2. After 12 weeks of high-fat diet",
               "2. After 12 weeks of high-fat diet",
               "2. After 12 weeks of high-fat diet",
               "2. After 12 weeks of high-fat diet",
               "2. After 12 weeks of high-fat diet"
            ]
         }
      }

      // Create the configuration for the graph
      var config = {
         "graphType" : "Dumbbell",
         "graphOrientation" : "horizontal",
         "dumbbellType" : "connected",
         "theme" : "minimal",
         "colorScheme" : "User",
         "colors" : [
            "#bdbdbd",
            "#bdbdbd",
            "#009E73"
         ],
         "title" : "Fasting glucose by age group",
         "subtitle" : "Mean and 95% interval (mmol/L) before and after a 12-week high-fat diet",
         "xAxis" : [
            "Lower 95%",
            "Upper 95%",
            "Mean"
         ],
         "xAxisTitle" : "Fasting glucose (mmol/L)",
         "showLegend" : false,
         "smpLabelInterval" : 1,
         "dataPointSizeScaleFactor" : 2,
         "segregateSamplesBy" : [
            "Wave"
         ],
         "stripBackgroundBorderColor" : "rgba(255,255,255,0)",
         "layoutTopology" : "2X1",
         "decorations" : {
            "range" : [
               {
                  "value" : 3.9,
                  "value2" : 5.6,
                  "color" : "rgba(0,158,115,0.12)",
                  "tooltip" : "Normal fasting range"
               }
            ],
            "text" : [
               {
                  "value" : 6.1,
                  "smpId" : 0,
                  "panel" : 1,
                  "label" : "◀ Normal fasting range",
                  "color" : "#009E73",
                  "labelScaleFontFactor" : 0.9
               }
            ]
         },
         "citation" : "Source: synthetic data for illustration"
      }

      // Event used to create graph (optional)
      var events = false

            // Call the CanvasXpress function to create the graph
      var cX = new CanvasXpress("canvasId", data, config, events);

    </script>

  </body>

</html>
library(canvasXpress)
y=read.table("https://www.canvasxpress.org/data/r/cX-dumbbell11-dat.txt", header=TRUE, sep="\t", quote="", row.names=1, fill=TRUE, check.names=FALSE, stringsAsFactors=FALSE)
x=read.table("https://www.canvasxpress.org/data/r/cX-dumbbell11-smp.txt", header=TRUE, sep="\t", quote="", row.names=1, fill=TRUE, check.names=FALSE, stringsAsFactors=FALSE)
canvasXpress(
data=y,
smpAnnot=x,
citation="Source: synthetic data for illustration",
colorScheme="User",
colors=list("#bdbdbd", "#bdbdbd", "#009E73"),
dataPointSizeScaleFactor=2,
decorations=list(range=list(list(color="rgba(0,158,115,0.12)", tooltip="Normal fasting range", value=3.9, value2=5.6)), text=list(list(color="#009E73", label="◀ Normal fasting range", labelScaleFontFactor=0.9, panel=1, smpId=0, value=6.1))),
dumbbellType="connected",
graphOrientation="horizontal",
graphType="Dumbbell",
layoutTopology="2X1",
segregateSamplesBy=list("Wave"),
showLegend=FALSE,
smpLabelInterval=1,
stripBackgroundBorderColor="rgba(255,255,255,0)",
subtitle="Mean and 95% interval (mmol/L) before and after a 12-week high-fat diet",
theme="minimal",
title="Fasting glucose by age group",
xAxis=list("Lower 95%", "Upper 95%", "Mean"),
xAxisTitle="Fasting glucose (mmol/L)"
)
from canvasxpress.canvas import CanvasXpress
from canvasxpress.plot import show_in_browser

if __name__ == "__main__":
  # Define the chart with its data and configuration
  chart: CanvasXpress = CanvasXpress(
    render_to = "dumbbell11",
    data = {
      "y": {
        "vars": ["Lower 95%", "Upper 95%", "Mean"],
        "smps": ["18-29", "30-39", "40-49", "50-59", "60-69", "70-79", "80+", "18-29 ", "30-39 ", "40-49 ", "50-59 ", "60-69 ", "70-79 ", "80+ "],
        "data": [
          [4.6, 4.8, 4.9, 5, 5, 5.2, 5.3, 4.7, 5, 5.5, 5.9, 6.2, 5.8, 5.3],
          [5.3, 5.5, 5.5, 5.7, 5.7, 5.9, 5.9, 6, 6.5, 7.2, 7.9, 8.4, 8.2, 8],
          [5, 5.1, 5.2, 5.3, 5.4, 5.5, 5.6, 5.4, 5.8, 6.3, 6.9, 7.3, 7, 6.6]
        ]
      },
      "x": {
        "Wave": ["1. Baseline", "1. Baseline", "1. Baseline", "1. Baseline", "1. Baseline", "1. Baseline", "1. Baseline", "2. After 12 weeks of high-fat diet", "2. After 12 weeks of high-fat diet", "2. After 12 weeks of high-fat diet", "2. After 12 weeks of high-fat diet", "2. After 12 weeks of high-fat diet", "2. After 12 weeks of high-fat diet", "2. After 12 weeks of high-fat diet"]
      }
    },
    config = {
      "graphType": "Dumbbell",
      "graphOrientation": "horizontal",
      "dumbbellType": "connected",
      "theme": "minimal",
      "colorScheme": "User",
      "colors": ["#bdbdbd", "#bdbdbd", "#009E73"],
      "title": "Fasting glucose by age group",
      "subtitle": "Mean and 95% interval (mmol/L) before and after a 12-week high-fat diet",
      "xAxis": ["Lower 95%", "Upper 95%", "Mean"],
      "xAxisTitle": "Fasting glucose (mmol/L)",
      "showLegend": False,
      "smpLabelInterval": 1,
      "dataPointSizeScaleFactor": 2,
      "segregateSamplesBy": ["Wave"],
      "stripBackgroundBorderColor": "rgba(255,255,255,0)",
      "layoutTopology": "2X1",
      "decorations": {
        "range": [
          {
            "value": 3.9,
            "value2": 5.6,
            "color": "rgba(0,158,115,0.12)",
            "tooltip": "Normal fasting range"
          }
        ],
        "text": [
          {
            "value": 6.1,
            "smpId": 0,
            "panel": 1,
            "label": "◀ Normal fasting range",
            "color": "#009E73",
            "labelScaleFontFactor": 0.9
          }
        ]
      },
      "citation": "Source: synthetic data for illustration"
    },
    width = 760,
    height = 640
  )

  # Display the chart in its own Web page
  show_in_browser(chart)
Run this notebook:

from canvasxpress.canvas import CanvasXpress
from canvasxpress.plot import graph

graph(
  CanvasXpress(
    render_to = "dumbbell11",
    data = {
      "y": {
        "vars": ["Lower 95%", "Upper 95%", "Mean"],
        "smps": ["18-29", "30-39", "40-49", "50-59", "60-69", "70-79", "80+", "18-29 ", "30-39 ", "40-49 ", "50-59 ", "60-69 ", "70-79 ", "80+ "],
        "data": [
          [4.6, 4.8, 4.9, 5, 5, 5.2, 5.3, 4.7, 5, 5.5, 5.9, 6.2, 5.8, 5.3],
          [5.3, 5.5, 5.5, 5.7, 5.7, 5.9, 5.9, 6, 6.5, 7.2, 7.9, 8.4, 8.2, 8],
          [5, 5.1, 5.2, 5.3, 5.4, 5.5, 5.6, 5.4, 5.8, 6.3, 6.9, 7.3, 7, 6.6]
        ]
      },
      "x": {
        "Wave": ["1. Baseline", "1. Baseline", "1. Baseline", "1. Baseline", "1. Baseline", "1. Baseline", "1. Baseline", "2. After 12 weeks of high-fat diet", "2. After 12 weeks of high-fat diet", "2. After 12 weeks of high-fat diet", "2. After 12 weeks of high-fat diet", "2. After 12 weeks of high-fat diet", "2. After 12 weeks of high-fat diet", "2. After 12 weeks of high-fat diet"]
      }
    },
    config = {
      "graphType": "Dumbbell",
      "graphOrientation": "horizontal",
      "dumbbellType": "connected",
      "theme": "minimal",
      "colorScheme": "User",
      "colors": ["#bdbdbd", "#bdbdbd", "#009E73"],
      "title": "Fasting glucose by age group",
      "subtitle": "Mean and 95% interval (mmol/L) before and after a 12-week high-fat diet",
      "xAxis": ["Lower 95%", "Upper 95%", "Mean"],
      "xAxisTitle": "Fasting glucose (mmol/L)",
      "showLegend": False,
      "smpLabelInterval": 1,
      "dataPointSizeScaleFactor": 2,
      "segregateSamplesBy": ["Wave"],
      "stripBackgroundBorderColor": "rgba(255,255,255,0)",
      "layoutTopology": "2X1",
      "decorations": {
        "range": [
          {
            "value": 3.9,
            "value2": 5.6,
            "color": "rgba(0,158,115,0.12)",
            "tooltip": "Normal fasting range"
          }
        ],
        "text": [
          {
            "value": 6.1,
            "smpId": 0,
            "panel": 1,
            "label": "◀ Normal fasting range",
            "color": "#009E73",
            "labelScaleFontFactor": 0.9
          }
        ]
      },
      "citation": "Source: synthetic data for illustration"
    },
    width = 760,
    height = 640
  )
)
using CanvasXpress

canvasxpress(Dict(
  "y" => Dict(
    "vars" => ["Lower 95%", "Upper 95%", "Mean"],
    "smps" => ["18-29", "30-39", "40-49", "50-59", "60-69", "70-79", "80+", "18-29 ", "30-39 ", "40-49 ", "50-59 ", "60-69 ", "70-79 ", "80+ "],
    "data" => [
      [4.6, 4.8, 4.9, 5, 5, 5.2, 5.3, 4.7, 5, 5.5, 5.9, 6.2, 5.8, 5.3],
      [5.3, 5.5, 5.5, 5.7, 5.7, 5.9, 5.9, 6, 6.5, 7.2, 7.9, 8.4, 8.2, 8],
      [5, 5.1, 5.2, 5.3, 5.4, 5.5, 5.6, 5.4, 5.8, 6.3, 6.9, 7.3, 7, 6.6]
    ]
  ),
  "x" => Dict(
    "Wave" => ["1. Baseline", "1. Baseline", "1. Baseline", "1. Baseline", "1. Baseline", "1. Baseline", "1. Baseline", "2. After 12 weeks of high-fat diet", "2. After 12 weeks of high-fat diet", "2. After 12 weeks of high-fat diet", "2. After 12 weeks of high-fat diet", "2. After 12 weeks of high-fat diet", "2. After 12 weeks of high-fat diet", "2. After 12 weeks of high-fat diet"]
  )
);
  graphType = "Dumbbell",
  graphOrientation = "horizontal",
  dumbbellType = "connected",
  theme = "minimal",
  colorScheme = "User",
  colors = ["#bdbdbd", "#bdbdbd", "#009E73"],
  title = "Fasting glucose by age group",
  subtitle = "Mean and 95% interval (mmol/L) before and after a 12-week high-fat diet",
  xAxis = ["Lower 95%", "Upper 95%", "Mean"],
  xAxisTitle = "Fasting glucose (mmol/L)",
  showLegend = false,
  smpLabelInterval = 1,
  dataPointSizeScaleFactor = 2,
  segregateSamplesBy = ["Wave"],
  stripBackgroundBorderColor = "rgba(255,255,255,0)",
  layoutTopology = "2X1",
  decorations = Dict(
    "range" => [
      Dict(
        "value" => 3.9,
        "value2" => 5.6,
        "color" => "rgba(0,158,115,0.12)",
        "tooltip" => "Normal fasting range"
      )
    ],
    "text" => [
      Dict(
        "value" => 6.1,
        "smpId" => 0,
        "panel" => 1,
        "label" => "◀ Normal fasting range",
        "color" => "#009E73",
        "labelScaleFontFactor" => 0.9
      )
    ]
  ),
  citation = "Source: synthetic data for illustration"
)