Examples
Documentation
Architecture
Interfaces
MCP
Dashboards
Pricing
Updates
Contact
Site styles
Classic
Paper
Slate
Mono
Sunrise
Ocean
Midnight
Graphite
Forest
Widgets looks
CX
BMS
Colorful
RDC
NGS360
Chart themes
Economist
ggplot
Editorial
Paul Tol
Wall Street Journal
Tableau
Stata
Solarized
Excel
Highcharts
ggblanket
Black and White
Classic (ggplot)
Light (ggplot)
Dark (ggplot)
Minimal (ggplot)
Linedraw (ggplot)
Void (ggplot)
High contrast
CanvasXpress Traditional
CanvasXpress Dark
CanvasXpress Blue
×
Search CanvasXpress
Ask
Expand all
/
Collapse all
Comparison & Ranking
Bar-based
Bar
Lollipop
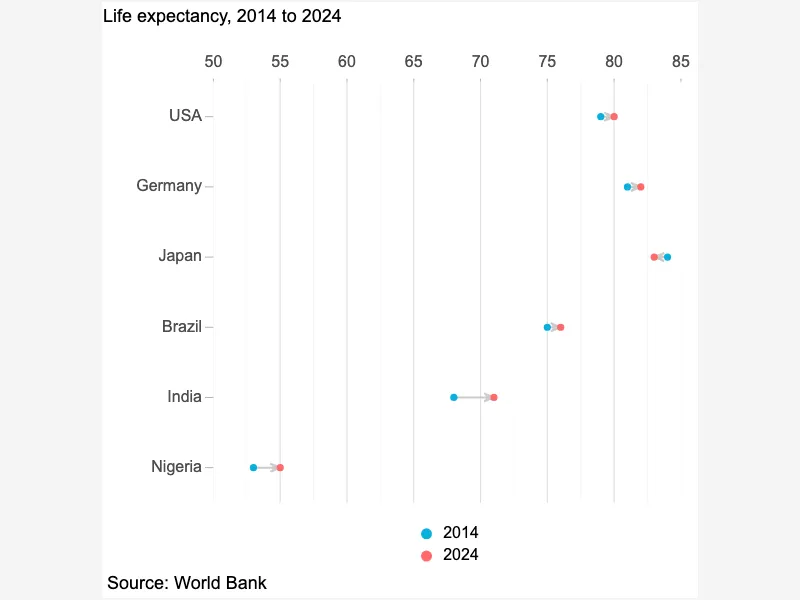
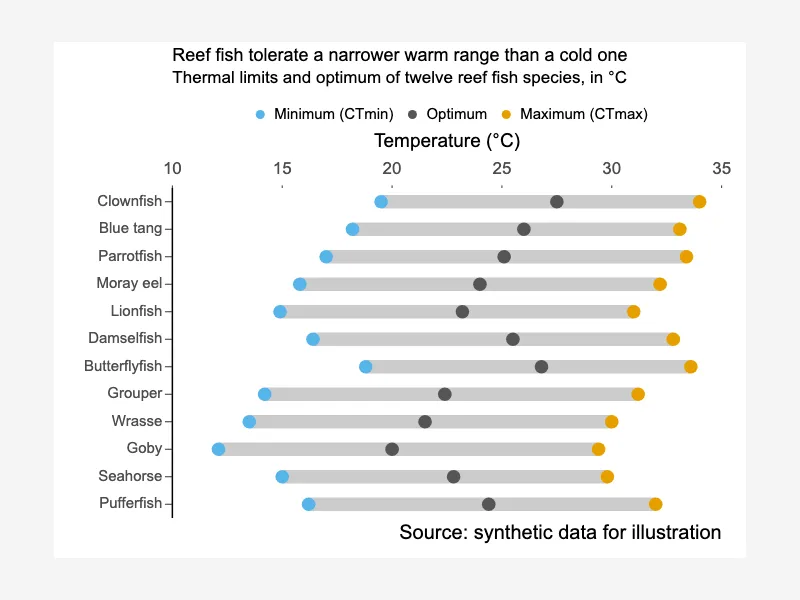
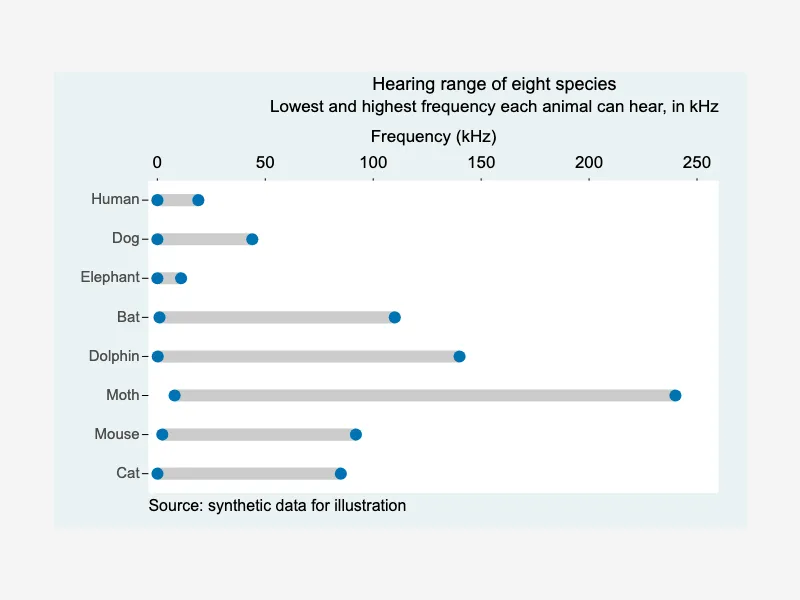
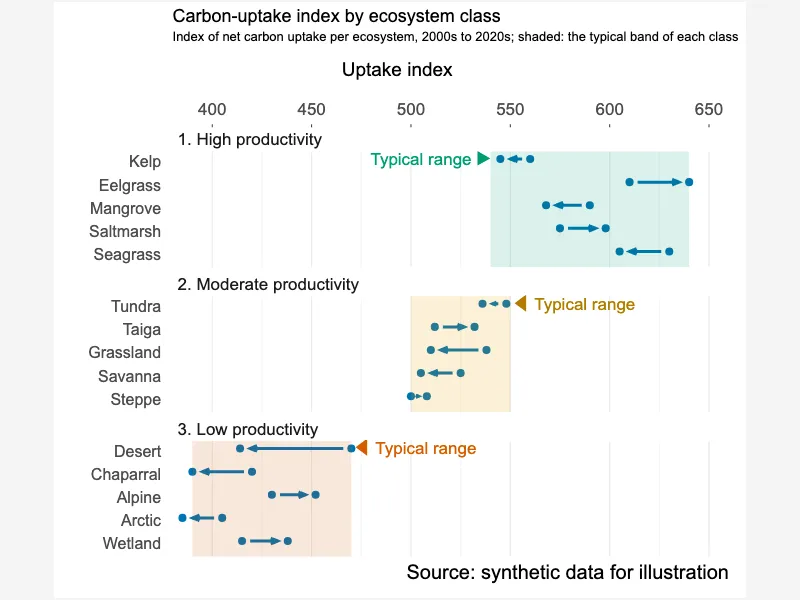
Dumbbell
Bullet
Dotplot
Waterfall
Radial
Radar
Circular
Meter
Composition
Stacked
Stacked
StackedPercent
Proportional
Pie
Donnut
Treemap
Sunburst
Sets
Venn
UpSet
Distribution
Boxplot
Violin
Histogram
Density
Ridge-Line
Relationship
Scatter & bubble
Scatter2D
Scatter3D
ScatterBubble2D
3D-Plots
Bubble
2-D density
Contour
Hexplot-Binplot
Matrix
Correlation
SPLOM
Heatmap
Model fits
Linear-Fit
NonLinear-Fit
Trends & Time
Time series
Time-Series
Lines & areas
Line
Area
AreaLine
Streamgraph
Combination
BarLine
DotLine
StackedLine
StackedPercentLine
Timelines
Gantt
Swimmer
Connections & Hierarchy
Flow
Sankey
Chord
Tree & network
Tree
Network
Geospatial
Map
Domain-specific
Genomics & clinical
Genome
Oncoprint
TCGA
Kaplan-Meier
Fish
Multivariate & text
ParallelCoordinates
TagCloud
Financial
OptionsWall
Layout & Utilities
Dashboard
Facet
Layout
Remote-Graphs
Functions
Dumbbell Chart
Show All
⇧