Yearly totals as percent of the mean, two panels
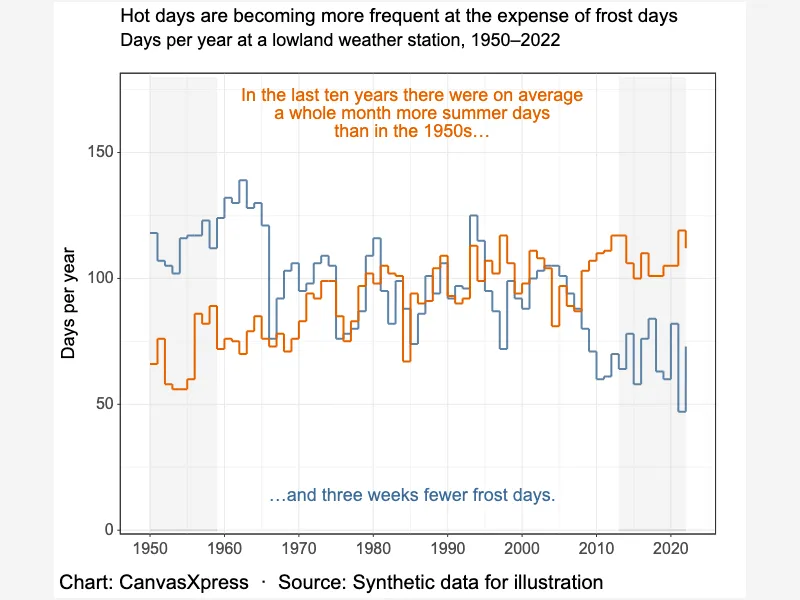
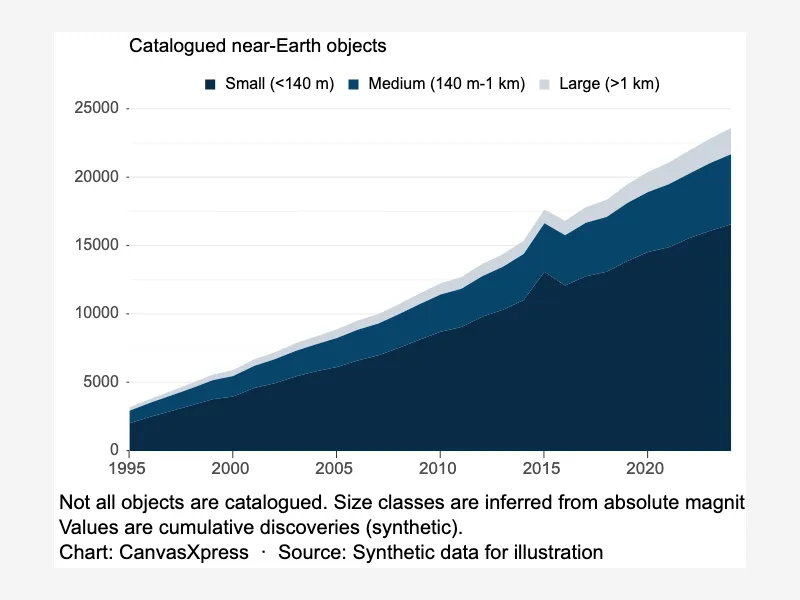
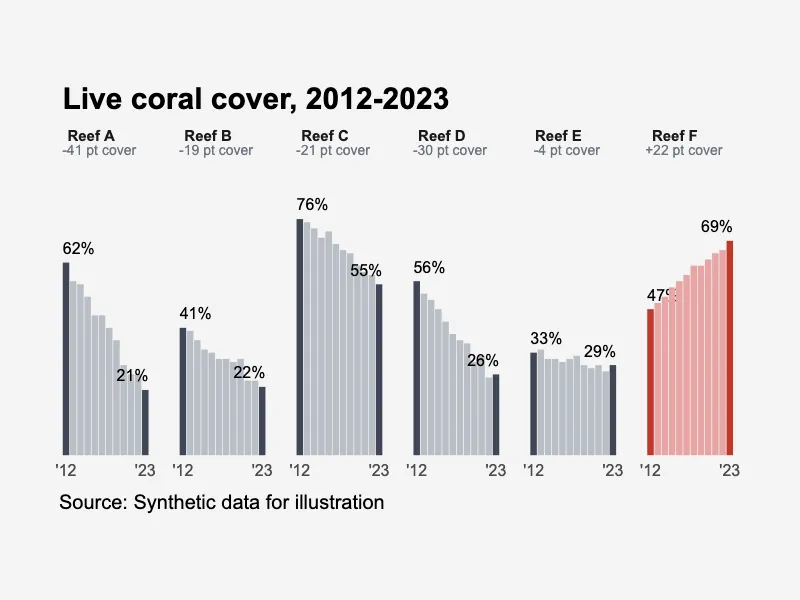
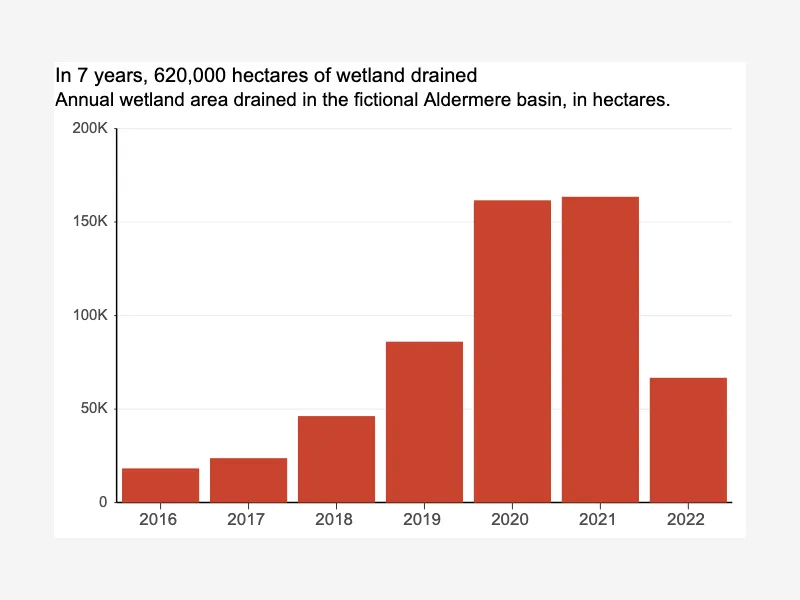
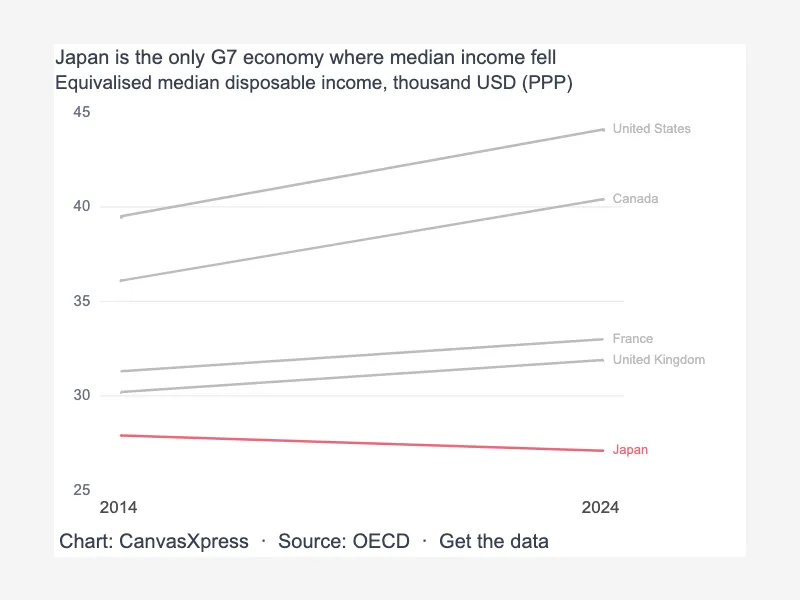
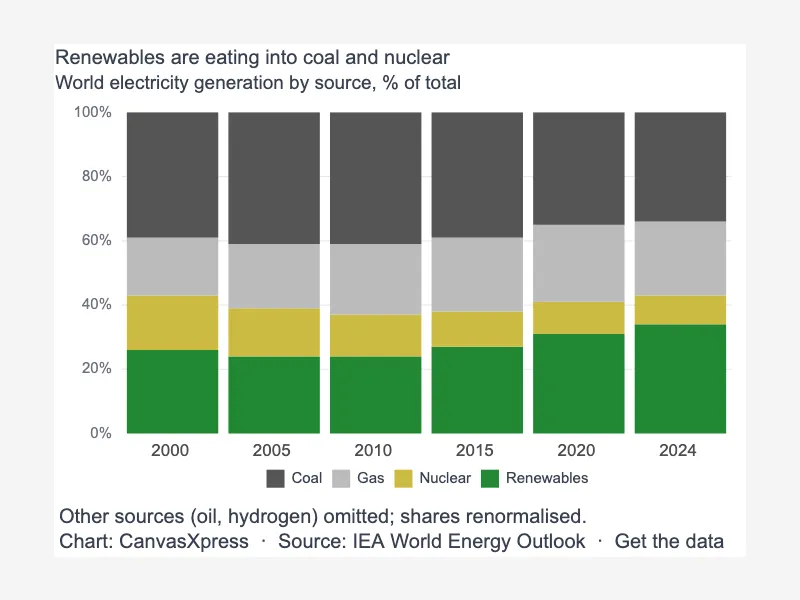
Time series charts in CanvasXpress show how values change over calendar time: annual, monthly and daily series as lines, step lines, areas, columns and small multiples, with confidence bands, projections, shaded periods, event callouts, dual axes and direct end labels. These examples recreate editorial chart idioms (the Datawrapper reference set) with synthetic data and publication-style themes; every one of them is an ordinary Scatter2D, Line, Area, AreaLine, Bar, BarLine or Stacked configuration, so the same options apply to your own dated data.


<html>

  <head>
    <!-- Include the CanvasXpress library in your HTML file -->
    <link rel="stylesheet" href="https://www.canvasxpress.org/dist/canvasXpress.css" type="text/css"/>
    <script src="https://www.canvasxpress.org/dist/canvasXpress.min.js"></script>
  </head>

  <body>

    <!-- Create a canvas element for the chart with the desired dimensions -->
    <div>
      <canvas id="canvasId" width="600" height="600"></canvas>
    </div>


    <!-- Create a script to initialize the chart -->
    <script>

      // Use a data frame (2D-array) for the graph
      var data =

      // Create the configuration for the graph
      var config = {
         "graphType" : "Bar",
         "theme" : "ggplot",
         "titleAlign" : "plot::0",
         "subtitleAlign" : "plot::0",
         "graphOrientation" : "vertical",
         "xAxis" : [
            "Rainfall (% of mean)",
            "Sunshine (% of mean)"
         ],
         "segregateVariablesBy" : [
            "Panel"
         ],
         "colorBy" : "Period",
         "colorScheme" : "User",
         "colors" : [
            "#9ec9d9",
            "#0072B2"
         ],
         "showLegend" : false,
         "smpLabelInterval" : 5,
         "smpTextRotate" : 0,
         "xAxisTitle" : "% of 25-year mean",
         "stripBackgroundColor" : "rgba(255,255,255,0)",
         "stripBackgroundBorderColor" : "rgba(255,255,255,0)",
         "stripTextAlign" : "left",
         "stripTextFontStyle" : "bold",
         "decorations" : {
            "line" : [
               {
                  "color" : "#444444",
                  "value" : 100,
                  "width" : 1.5,
                  "type" : "dashed",
                  "label" : "25-YEAR AVERAGE",
                  "align" : "left",
                  "position" : "under"
               }
            ],
            "text" : [
               {
                  "catX" : 16.5,
                  "value" : 28,
                  "label" : "Wettest years\nin a while",
                  "panel" : 1,
                  "color" : "#0072B2",
                  "labelScaleFontFactor" : 1.15
               },
               {
                  "catX" : 16,
                  "value" : 28,
                  "label" : "2024 was\nparticularly cloudy",
                  "panel" : 2,
                  "color" : "#0072B2",
                  "labelScaleFontFactor" : 1.15
               }
            ]
         },
         "title" : "Weather at a synthetic station is usually quite predictable",
         "subtitle" : "Yearly totals as % of the 25-year average, 2000-2024 (synthetic)"
      }

      // Event used to create graph (optional)
      var events = false

      // Call the CanvasXpress function to create the graph
      var cX = new CanvasXpress("canvasId", data, config, events);

    </script>

  </body>

</html>
<html>

  <head>
    <!-- Include the CanvasXpress library in your HTML file -->
    <link rel="stylesheet" href="https://www.canvasxpress.org/dist/canvasXpress.css" type="text/css"/>
    <script src="https://www.canvasxpress.org/dist/canvasXpress.min.js"></script>
  </head>

  <body>

    <!-- Create a canvas element for the chart with the desired dimensions -->
    <div>
      <canvas id="canvasId" width="600" height="600"></canvas>
    </div>


    <!-- Create a script to initialize the chart -->
    <script>

      // Create the data for the graph
      var data = {
         "y" : {
            "vars" : [
               "Rainfall (% of mean)",
               "Sunshine (% of mean)"
            ],
            "smps" : [
               "2000 ",
               "2001 ",
               "2002 ",
               "2003 ",
               "2004 ",
               "2005 ",
               "2006 ",
               "2007 ",
               "2008 ",
               "2009 ",
               "2010 ",
               "2011 ",
               "2012 ",
               "2013 ",
               "2014 ",
               "2015 ",
               "2016 ",
               "2017 ",
               "2018 ",
               "2019 ",
               "2020 ",
               "2021 ",
               "2022 ",
               "2023 ",
               "2024 "
            ],
            "data" : [
               [
                  97,
                  91,
                  99,
                  115,
                  98,
                  88,
                  105,
                  84,
                  88,
                  113,
                  100,
                  102,
                  84,
                  112,
                  106,
                  87,
                  95,
                  105,
                  96,
                  103,
                  93,
                  135,
                  124,
                  117,
                  102
               ],
               [
                  98,
                  96,
                  114,
                  94,
                  110,
                  94,
                  94,
                  115,
                  102,
                  84,
                  90,
                  99,
                  106,
                  114,
                  103,
                  94,
                  93,
                  97,
                  115,
                  109,
                  113,
                  111,
                  71,
                  68,
                  92
               ]
            ]
         },
         "x" : {
            "Period" : [
               "Earlier",
               "Earlier",
               "Earlier",
               "Earlier",
               "Earlier",
               "Earlier",
               "Earlier",
               "Earlier",
               "Earlier",
               "Earlier",
               "Earlier",
               "Earlier",
               "Earlier",
               "Earlier",
               "Earlier",
               "Earlier",
               "Earlier",
               "Earlier",
               "Earlier",
               "Earlier",
               "Earlier",
               "Earlier",
               "Earlier",
               "Recent",
               "Recent"
            ]
         },
         "z" : {
            "Panel" : [
               "Rainfall",
               "Sunshine"
            ]
         }
      }

      // Create the configuration for the graph
      var config = {
         "graphType" : "Bar",
         "theme" : "ggplot",
         "titleAlign" : "plot::0",
         "subtitleAlign" : "plot::0",
         "graphOrientation" : "vertical",
         "xAxis" : [
            "Rainfall (% of mean)",
            "Sunshine (% of mean)"
         ],
         "segregateVariablesBy" : [
            "Panel"
         ],
         "colorBy" : "Period",
         "colorScheme" : "User",
         "colors" : [
            "#9ec9d9",
            "#0072B2"
         ],
         "showLegend" : false,
         "smpLabelInterval" : 5,
         "smpTextRotate" : 0,
         "xAxisTitle" : "% of 25-year mean",
         "stripBackgroundColor" : "rgba(255,255,255,0)",
         "stripBackgroundBorderColor" : "rgba(255,255,255,0)",
         "stripTextAlign" : "left",
         "stripTextFontStyle" : "bold",
         "decorations" : {
            "line" : [
               {
                  "color" : "#444444",
                  "value" : 100,
                  "width" : 1.5,
                  "type" : "dashed",
                  "label" : "25-YEAR AVERAGE",
                  "align" : "left",
                  "position" : "under"
               }
            ],
            "text" : [
               {
                  "catX" : 16.5,
                  "value" : 28,
                  "label" : "Wettest years\nin a while",
                  "panel" : 1,
                  "color" : "#0072B2",
                  "labelScaleFontFactor" : 1.15
               },
               {
                  "catX" : 16,
                  "value" : 28,
                  "label" : "2024 was\nparticularly cloudy",
                  "panel" : 2,
                  "color" : "#0072B2",
                  "labelScaleFontFactor" : 1.15
               }
            ]
         },
         "title" : "Weather at a synthetic station is usually quite predictable",
         "subtitle" : "Yearly totals as % of the 25-year average, 2000-2024 (synthetic)"
      }

      // Event used to create graph (optional)
      var events = false

            // Call the CanvasXpress function to create the graph
      var cX = new CanvasXpress("canvasId", data, config, events);

    </script>

  </body>

</html>
from canvasxpress.canvas import CanvasXpress
from canvasxpress.plot import show_in_browser

if __name__ == "__main__":
  # Define the chart with its data and configuration
  chart: CanvasXpress = CanvasXpress(
    render_to = "timeseries19",
    data = {
      "y": {
        "vars": ["Rainfall (% of mean)", "Sunshine (% of mean)"],
        "smps": ["2000 ", "2001 ", "2002 ", "2003 ", "2004 ", "2005 ", "2006 ", "2007 ", "2008 ", "2009 ", "2010 ", "2011 ", "2012 ", "2013 ", "2014 ", "2015 ", "2016 ", "2017 ", "2018 ", "2019 ", "2020 ", "2021 ", "2022 ", "2023 ", "2024 "],
        "data": [
          [97, 91, 99, 115, 98, 88, 105, 84, 88, 113, 100, 102, 84, 112, 106, 87, 95, 105, 96, 103, 93, 135, 124, 117, 102],
          [98, 96, 114, 94, 110, 94, 94, 115, 102, 84, 90, 99, 106, 114, 103, 94, 93, 97, 115, 109, 113, 111, 71, 68, 92]
        ]
      },
      "x": {
        "Period": ["Earlier", "Earlier", "Earlier", "Earlier", "Earlier", "Earlier", "Earlier", "Earlier", "Earlier", "Earlier", "Earlier", "Earlier", "Earlier", "Earlier", "Earlier", "Earlier", "Earlier", "Earlier", "Earlier", "Earlier", "Earlier", "Earlier", "Earlier", "Recent", "Recent"]
      },
      "z": {
        "Panel": ["Rainfall", "Sunshine"]
      }
    },
    config = {
      "graphType": "Bar",
      "theme": "ggplot",
      "titleAlign": "plot::0",
      "subtitleAlign": "plot::0",
      "graphOrientation": "vertical",
      "xAxis": ["Rainfall (% of mean)", "Sunshine (% of mean)"],
      "segregateVariablesBy": ["Panel"],
      "colorBy": "Period",
      "colorScheme": "User",
      "colors": ["#9ec9d9", "#0072B2"],
      "showLegend": False,
      "smpLabelInterval": 5,
      "smpTextRotate": 0,
      "xAxisTitle": "% of 25-year mean",
      "stripBackgroundColor": "rgba(255,255,255,0)",
      "stripBackgroundBorderColor": "rgba(255,255,255,0)",
      "stripTextAlign": "left",
      "stripTextFontStyle": "bold",
      "decorations": {
        "line": [
          {
            "color": "#444444",
            "value": 100,
            "width": 1.5,
            "type": "dashed",
            "label": "25-YEAR AVERAGE",
            "align": "left",
            "position": "under"
          }
        ],
        "text": [
          {
            "catX": 16.5,
            "value": 28,
            "label": "Wettest years\nin a while",
            "panel": 1,
            "color": "#0072B2",
            "labelScaleFontFactor": 1.15
          },
          {
            "catX": 16,
            "value": 28,
            "label": "2024 was\nparticularly cloudy",
            "panel": 2,
            "color": "#0072B2",
            "labelScaleFontFactor": 1.15
          }
        ]
      },
      "title": "Weather at a synthetic station is usually quite predictable",
      "subtitle": "Yearly totals as % of the 25-year average, 2000-2024 (synthetic)"
    },
    width = 760,
    height = 520
  )

  # Display the chart in its own Web page
  show_in_browser(chart)
Run this notebook:

from canvasxpress.canvas import CanvasXpress
from canvasxpress.plot import graph

graph(
  CanvasXpress(
    render_to = "timeseries19",
    data = {
      "y": {
        "vars": ["Rainfall (% of mean)", "Sunshine (% of mean)"],
        "smps": ["2000 ", "2001 ", "2002 ", "2003 ", "2004 ", "2005 ", "2006 ", "2007 ", "2008 ", "2009 ", "2010 ", "2011 ", "2012 ", "2013 ", "2014 ", "2015 ", "2016 ", "2017 ", "2018 ", "2019 ", "2020 ", "2021 ", "2022 ", "2023 ", "2024 "],
        "data": [
          [97, 91, 99, 115, 98, 88, 105, 84, 88, 113, 100, 102, 84, 112, 106, 87, 95, 105, 96, 103, 93, 135, 124, 117, 102],
          [98, 96, 114, 94, 110, 94, 94, 115, 102, 84, 90, 99, 106, 114, 103, 94, 93, 97, 115, 109, 113, 111, 71, 68, 92]
        ]
      },
      "x": {
        "Period": ["Earlier", "Earlier", "Earlier", "Earlier", "Earlier", "Earlier", "Earlier", "Earlier", "Earlier", "Earlier", "Earlier", "Earlier", "Earlier", "Earlier", "Earlier", "Earlier", "Earlier", "Earlier", "Earlier", "Earlier", "Earlier", "Earlier", "Earlier", "Recent", "Recent"]
      },
      "z": {
        "Panel": ["Rainfall", "Sunshine"]
      }
    },
    config = {
      "graphType": "Bar",
      "theme": "ggplot",
      "titleAlign": "plot::0",
      "subtitleAlign": "plot::0",
      "graphOrientation": "vertical",
      "xAxis": ["Rainfall (% of mean)", "Sunshine (% of mean)"],
      "segregateVariablesBy": ["Panel"],
      "colorBy": "Period",
      "colorScheme": "User",
      "colors": ["#9ec9d9", "#0072B2"],
      "showLegend": False,
      "smpLabelInterval": 5,
      "smpTextRotate": 0,
      "xAxisTitle": "% of 25-year mean",
      "stripBackgroundColor": "rgba(255,255,255,0)",
      "stripBackgroundBorderColor": "rgba(255,255,255,0)",
      "stripTextAlign": "left",
      "stripTextFontStyle": "bold",
      "decorations": {
        "line": [
          {
            "color": "#444444",
            "value": 100,
            "width": 1.5,
            "type": "dashed",
            "label": "25-YEAR AVERAGE",
            "align": "left",
            "position": "under"
          }
        ],
        "text": [
          {
            "catX": 16.5,
            "value": 28,
            "label": "Wettest years\nin a while",
            "panel": 1,
            "color": "#0072B2",
            "labelScaleFontFactor": 1.15
          },
          {
            "catX": 16,
            "value": 28,
            "label": "2024 was\nparticularly cloudy",
            "panel": 2,
            "color": "#0072B2",
            "labelScaleFontFactor": 1.15
          }
        ]
      },
      "title": "Weather at a synthetic station is usually quite predictable",
      "subtitle": "Yearly totals as % of the 25-year average, 2000-2024 (synthetic)"
    },
    width = 760,
    height = 520
  )
)
using CanvasXpress

canvasxpress(Dict(
  "y" => Dict(
    "vars" => ["Rainfall (% of mean)", "Sunshine (% of mean)"],
    "smps" => ["2000 ", "2001 ", "2002 ", "2003 ", "2004 ", "2005 ", "2006 ", "2007 ", "2008 ", "2009 ", "2010 ", "2011 ", "2012 ", "2013 ", "2014 ", "2015 ", "2016 ", "2017 ", "2018 ", "2019 ", "2020 ", "2021 ", "2022 ", "2023 ", "2024 "],
    "data" => [
      [97, 91, 99, 115, 98, 88, 105, 84, 88, 113, 100, 102, 84, 112, 106, 87, 95, 105, 96, 103, 93, 135, 124, 117, 102],
      [98, 96, 114, 94, 110, 94, 94, 115, 102, 84, 90, 99, 106, 114, 103, 94, 93, 97, 115, 109, 113, 111, 71, 68, 92]
    ]
  ),
  "x" => Dict(
    "Period" => ["Earlier", "Earlier", "Earlier", "Earlier", "Earlier", "Earlier", "Earlier", "Earlier", "Earlier", "Earlier", "Earlier", "Earlier", "Earlier", "Earlier", "Earlier", "Earlier", "Earlier", "Earlier", "Earlier", "Earlier", "Earlier", "Earlier", "Earlier", "Recent", "Recent"]
  ),
  "z" => Dict(
    "Panel" => ["Rainfall", "Sunshine"]
  )
);
  graphType = "Bar",
  theme = "ggplot",
  titleAlign = "plot::0",
  subtitleAlign = "plot::0",
  graphOrientation = "vertical",
  xAxis = ["Rainfall (% of mean)", "Sunshine (% of mean)"],
  segregateVariablesBy = ["Panel"],
  colorBy = "Period",
  colorScheme = "User",
  colors = ["#9ec9d9", "#0072B2"],
  showLegend = false,
  smpLabelInterval = 5,
  smpTextRotate = 0,
  xAxisTitle = "% of 25-year mean",
  stripBackgroundColor = "rgba(255,255,255,0)",
  stripBackgroundBorderColor = "rgba(255,255,255,0)",
  stripTextAlign = "left",
  stripTextFontStyle = "bold",
  decorations = Dict(
    "line" => [
      Dict(
        "color" => "#444444",
        "value" => 100,
        "width" => 1.5,
        "type" => "dashed",
        "label" => "25-YEAR AVERAGE",
        "align" => "left",
        "position" => "under"
      )
    ],
    "text" => [
      Dict(
        "catX" => 16.5,
        "value" => 28,
        "label" => "Wettest years\nin a while",
        "panel" => 1,
        "color" => "#0072B2",
        "labelScaleFontFactor" => 1.15
      ),
      Dict(
        "catX" => 16,
        "value" => 28,
        "label" => "2024 was\nparticularly cloudy",
        "panel" => 2,
        "color" => "#0072B2",
        "labelScaleFontFactor" => 1.15
      )
    ]
  ),
  title = "Weather at a synthetic station is usually quite predictable",
  subtitle = "Yearly totals as % of the 25-year average, 2000-2024 (synthetic)"
)