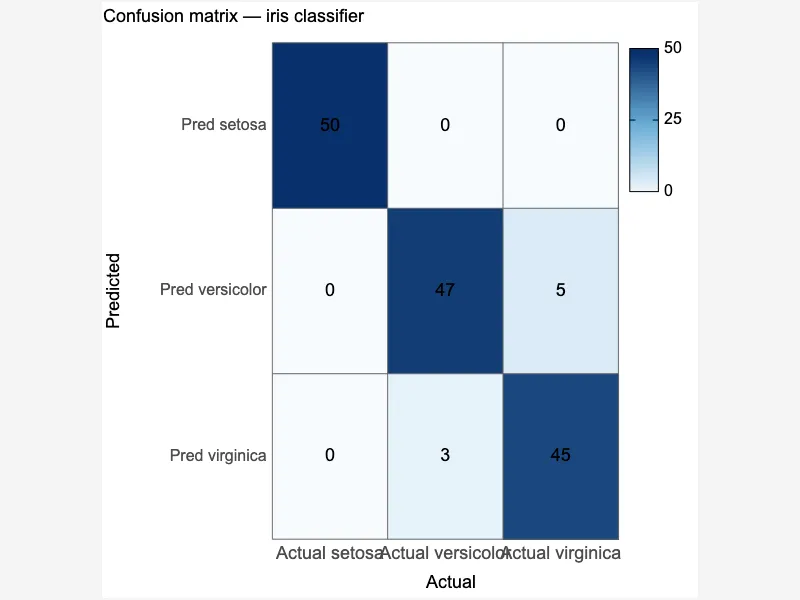
Confusion matrix (model evaluation)
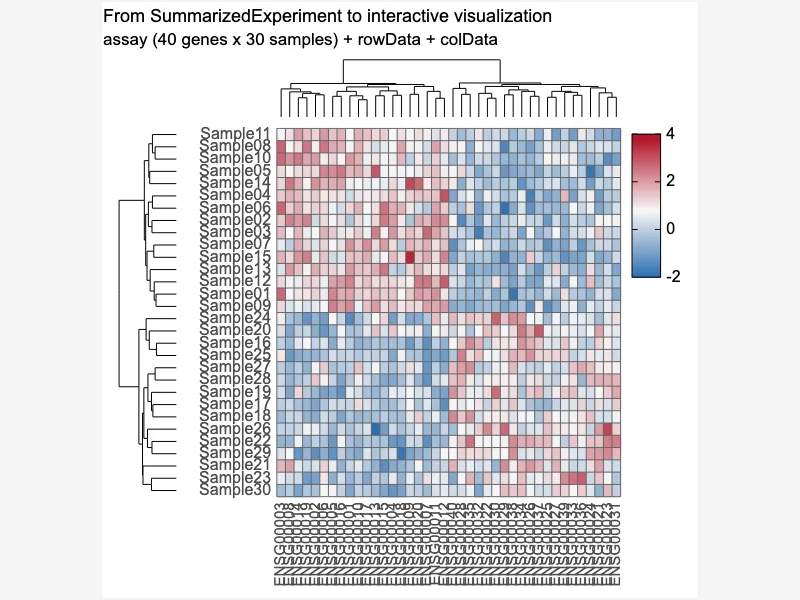
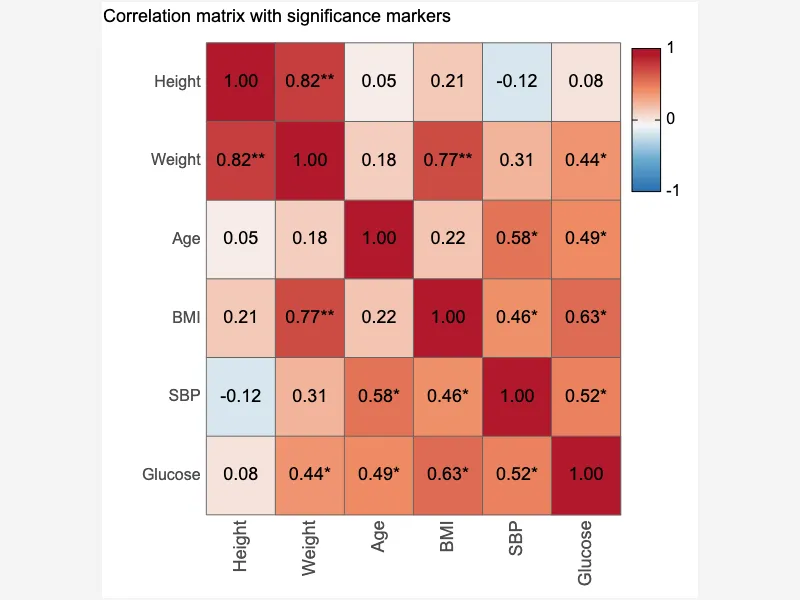
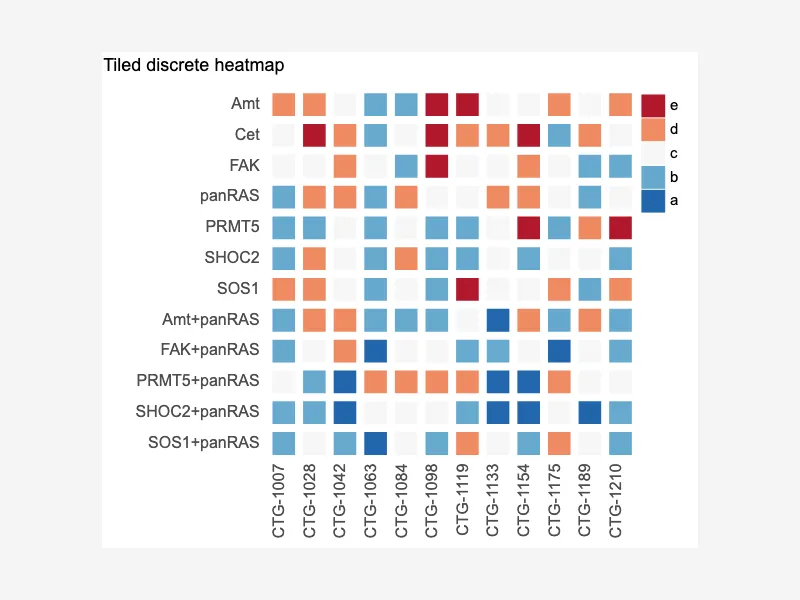
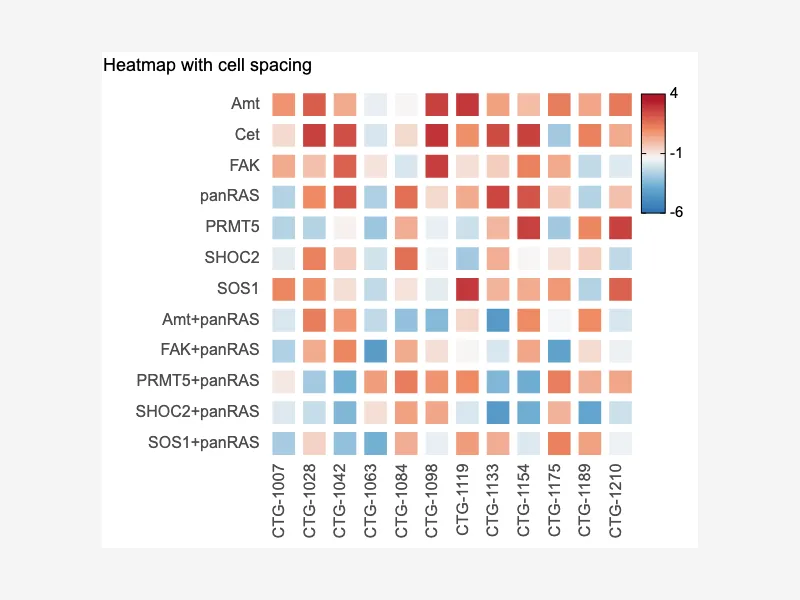
Heatmap graphs provide a visual representation of data using color variations to represent different values. They are incredibly useful for identifying patterns, trends, and outliers in datasets. Commonly used in various fields, from geographical analysis to website usability studies, heatmaps offer an intuitive way to understand complex data. Creating effective heatmaps involves selecting the appropriate color scheme and scaling to highlight meaningful differences. Interactive heatmaps further enhance analysis by allowing users to zoom, pan, and explore data points in detail. This makes them powerful tools for data-driven decision making across numerous disciplines.


<html>

  <head>
    <!-- Include the CanvasXpress library in your HTML file -->
    <link rel="stylesheet" href="https://www.canvasxpress.org/dist/canvasXpress.css" type="text/css"/>
    <script src="https://www.canvasxpress.org/dist/canvasXpress.min.js"></script>
  </head>

  <body>

    <!-- Create a canvas element for the chart with the desired dimensions -->
    <div>
      <canvas id="canvasId" width="600" height="600"></canvas>
    </div>


    <!-- Create a script to initialize the chart -->
    <script>

      // Create the data for the graph
      var data = {
         "y" : {
            "vars" : [
               "Actual setosa",
               "Actual versicolor",
               "Actual virginica"
            ],
            "smps" : [
               "Pred setosa",
               "Pred versicolor",
               "Pred virginica"
            ],
            "data" : [
               [
                  50,
                  0,
                  0
               ],
               [
                  0,
                  47,
                  3
               ],
               [
                  0,
                  5,
                  45
               ]
            ]
         }
      }

      // Create the configuration for the graph
      var config = {
         "graphType" : "Heatmap",
         "title" : "Confusion matrix — iris classifier",
         "varTitle" : "Actual",
         "smpTitle" : "Predicted",
         "heatmapCellBox" : true,
         "heatmapCellText" : [
            {
               "variable" : "Actual setosa",
               "sample" : "Pred setosa",
               "text" : "50"
            },
            {
               "variable" : "Actual setosa",
               "sample" : "Pred versicolor",
               "text" : "0"
            },
            {
               "variable" : "Actual setosa",
               "sample" : "Pred virginica",
               "text" : "0"
            },
            {
               "variable" : "Actual versicolor",
               "sample" : "Pred setosa",
               "text" : "0"
            },
            {
               "variable" : "Actual versicolor",
               "sample" : "Pred versicolor",
               "text" : "47"
            },
            {
               "variable" : "Actual versicolor",
               "sample" : "Pred virginica",
               "text" : "3"
            },
            {
               "variable" : "Actual virginica",
               "sample" : "Pred setosa",
               "text" : "0"
            },
            {
               "variable" : "Actual virginica",
               "sample" : "Pred versicolor",
               "text" : "5"
            },
            {
               "variable" : "Actual virginica",
               "sample" : "Pred virginica",
               "text" : "45"
            }
         ],
         "showTransition" : false,
         "colorSpectrum" : [
            "#f7fbff",
            "#6baed6",
            "#08306b"
         ],
         "showHeatmapIndicator" : true
      }

      // Event used to create graph (optional)
      var events = false

            // Call the CanvasXpress function to create the graph
      var cX = new CanvasXpress("canvasId", data, config, events);

    </script>

  </body>

</html>
library(canvasXpress)
y=read.table("https://www.canvasxpress.org/data/r/cX-heatmap24-dat.txt", header=TRUE, sep="\t", quote="", row.names=1, fill=TRUE, check.names=FALSE, stringsAsFactors=FALSE)
canvasXpress(
data=y,
colorSpectrum=list("#f7fbff", "#6baed6", "#08306b"),
graphType="Heatmap",
heatmapCellBox=TRUE,
heatmapCellText=list(list(sample="Pred setosa", text=50, variable="Actual setosa"), list(sample="Pred versicolor", text=0, variable="Actual setosa"), list(sample="Pred virginica", text=0, variable="Actual setosa"), list(sample="Pred setosa", text=0, variable="Actual versicolor"), list(sample="Pred versicolor", text=47, variable="Actual versicolor"), list(sample="Pred virginica", text=3, variable="Actual versicolor"), list(sample="Pred setosa", text=0, variable="Actual virginica"), list(sample="Pred versicolor", text=5, variable="Actual virginica"), list(sample="Pred virginica", text=45, variable="Actual virginica")),
showHeatmapIndicator=TRUE,
showTransition=FALSE,
smpTitle="Predicted",
title="Confusion matrix — iris classifier",
varTitle="Actual"
)
from canvasxpress.canvas import CanvasXpress
from canvasxpress.plot import show_in_browser

if __name__ == "__main__":
  # Define the chart with its data and configuration
  chart: CanvasXpress = CanvasXpress(
    render_to = "heatmap24",
    data = {
      "y": {
        "vars": ["Actual setosa", "Actual versicolor", "Actual virginica"],
        "smps": ["Pred setosa", "Pred versicolor", "Pred virginica"],
        "data": [
          [50, 0, 0],
          [0, 47, 3],
          [0, 5, 45]
        ]
      }
    },
    config = {
      "graphType": "Heatmap",
      "title": "Confusion matrix — iris classifier",
      "varTitle": "Actual",
      "smpTitle": "Predicted",
      "heatmapCellBox": True,
      "heatmapCellText": [
        {
          "variable": "Actual setosa",
          "sample": "Pred setosa",
          "text": "50"
        },
        {
          "variable": "Actual setosa",
          "sample": "Pred versicolor",
          "text": "0"
        },
        {
          "variable": "Actual setosa",
          "sample": "Pred virginica",
          "text": "0"
        },
        {
          "variable": "Actual versicolor",
          "sample": "Pred setosa",
          "text": "0"
        },
        {
          "variable": "Actual versicolor",
          "sample": "Pred versicolor",
          "text": "47"
        },
        {
          "variable": "Actual versicolor",
          "sample": "Pred virginica",
          "text": "3"
        },
        {
          "variable": "Actual virginica",
          "sample": "Pred setosa",
          "text": "0"
        },
        {
          "variable": "Actual virginica",
          "sample": "Pred versicolor",
          "text": "5"
        },
        {
          "variable": "Actual virginica",
          "sample": "Pred virginica",
          "text": "45"
        }
      ],
      "showTransition": False,
      "colorSpectrum": ["#f7fbff", "#6baed6", "#08306b"],
      "showHeatmapIndicator": True
    },
    width = 600,
    height = 600
  )

  # Display the chart in its own Web page
  show_in_browser(chart)
Run this notebook:

from canvasxpress.canvas import CanvasXpress
from canvasxpress.plot import graph

graph(
  CanvasXpress(
    render_to = "heatmap24",
    data = {
      "y": {
        "vars": ["Actual setosa", "Actual versicolor", "Actual virginica"],
        "smps": ["Pred setosa", "Pred versicolor", "Pred virginica"],
        "data": [
          [50, 0, 0],
          [0, 47, 3],
          [0, 5, 45]
        ]
      }
    },
    config = {
      "graphType": "Heatmap",
      "title": "Confusion matrix — iris classifier",
      "varTitle": "Actual",
      "smpTitle": "Predicted",
      "heatmapCellBox": True,
      "heatmapCellText": [
        {
          "variable": "Actual setosa",
          "sample": "Pred setosa",
          "text": "50"
        },
        {
          "variable": "Actual setosa",
          "sample": "Pred versicolor",
          "text": "0"
        },
        {
          "variable": "Actual setosa",
          "sample": "Pred virginica",
          "text": "0"
        },
        {
          "variable": "Actual versicolor",
          "sample": "Pred setosa",
          "text": "0"
        },
        {
          "variable": "Actual versicolor",
          "sample": "Pred versicolor",
          "text": "47"
        },
        {
          "variable": "Actual versicolor",
          "sample": "Pred virginica",
          "text": "3"
        },
        {
          "variable": "Actual virginica",
          "sample": "Pred setosa",
          "text": "0"
        },
        {
          "variable": "Actual virginica",
          "sample": "Pred versicolor",
          "text": "5"
        },
        {
          "variable": "Actual virginica",
          "sample": "Pred virginica",
          "text": "45"
        }
      ],
      "showTransition": False,
      "colorSpectrum": ["#f7fbff", "#6baed6", "#08306b"],
      "showHeatmapIndicator": True
    },
    width = 600,
    height = 600
  )
)
using CanvasXpress

canvasxpress(Dict(
  "y" => Dict(
    "vars" => ["Actual setosa", "Actual versicolor", "Actual virginica"],
    "smps" => ["Pred setosa", "Pred versicolor", "Pred virginica"],
    "data" => [
      [50, 0, 0],
      [0, 47, 3],
      [0, 5, 45]
    ]
  )
);
  graphType = "Heatmap",
  title = "Confusion matrix — iris classifier",
  varTitle = "Actual",
  smpTitle = "Predicted",
  heatmapCellBox = true,
  heatmapCellText = [
    Dict(
      "variable" => "Actual setosa",
      "sample" => "Pred setosa",
      "text" => "50"
    ),
    Dict(
      "variable" => "Actual setosa",
      "sample" => "Pred versicolor",
      "text" => "0"
    ),
    Dict(
      "variable" => "Actual setosa",
      "sample" => "Pred virginica",
      "text" => "0"
    ),
    Dict(
      "variable" => "Actual versicolor",
      "sample" => "Pred setosa",
      "text" => "0"
    ),
    Dict(
      "variable" => "Actual versicolor",
      "sample" => "Pred versicolor",
      "text" => "47"
    ),
    Dict(
      "variable" => "Actual versicolor",
      "sample" => "Pred virginica",
      "text" => "3"
    ),
    Dict(
      "variable" => "Actual virginica",
      "sample" => "Pred setosa",
      "text" => "0"
    ),
    Dict(
      "variable" => "Actual virginica",
      "sample" => "Pred versicolor",
      "text" => "5"
    ),
    Dict(
      "variable" => "Actual virginica",
      "sample" => "Pred virginica",
      "text" => "45"
    )
  ],
  showTransition = false,
  colorSpectrum = ["#f7fbff", "#6baed6", "#08306b"],
  showHeatmapIndicator = true
)